Corporate Sustainability
ENVIRONMENT
Energy Management
To respond to the challenges of global energy shortages and climate change, subsidiary CWTC consolidate energy-saving proposals from all units to set relevant targets and action plans each year and periodically monitors and controls performance. Additionally, we promote production machinery assessments to drive energy efficiency improvements in plant facilities.
Based on subsidiary CWTC's energy-saving plan submitted to the Bureau of Energy, Ministry of Economic Affairs, the average energy-saving rate approved for subsidiary CWTC's Taiwan Plant 2 was 1.28% to 2.13% in 2024. In line with the government's promotion of renewable energy, subsidiary CWTC increased the installed capacity of solar panels at our Taiwan plant in 2020, reaching a cumulative capacity of 233 kWp by 2024, generating 321,322 kWh.
CWE actively supports the government's renewable energy policies and adopts green electricity. In 2024, the Company purchased a Renewable Energy Certificate for NT$2,000, expecting a saving of 1,000 kWh of electricity. According to the 2024 electricity carbon emission factor of 0.474 kg CO2/kWh published by the Bureau of Energy, this initiative is estimated to reduce carbon emissions by approximately 0.474 metric tons.
The subsidiary, Chang Wah Technology, invested NT$32.91 million in 2025 to replace chillers and cooling towers and retrofit water pumps with VFDs at its Taiwan plants. These upgrades are projected to save 1,641,968 kWh of electricity per year.
※Energy Consumption
| Unit:GJ | Year | ||||
|---|---|---|---|---|---|
| Item | 2021 | 2022 | 2023 | 2024 | |
| Direct Energy | Diesel fuel | 276 | 1,174 | 365 | 416 |
| Gasoline | 361 | 500 | 656 | 901 | |
| Natural gas | 22,115 | 22,673 | 17,110 | 20,994 | |
| Indirect Enengy |
Purchased electricity |
268,055 | 279,597 | 275,936 | 317,495 |
| Renewable energy | - | - | 347 | 347 | |
| Total | 290,807 | 303,944 | 294,414 | 340,153 | |
Note 1:Conversions are based on the “Heat Content of Energy Products” of the Ministry of Economic Affairs. Starting from 2024, the unit conversion for diesel and gasoline will be calculated based on the calorific values announced by the Ministry of Environment.
Note 2:Renewable energy refers to solar energy, which is estimated annually based on the daily generation in GJ of the installed capacity.
Note 3:The 2023 data includes all consolidated entities, while data for other years covers only the manufacturing plants of subsidiaries.
※Electricity Usage
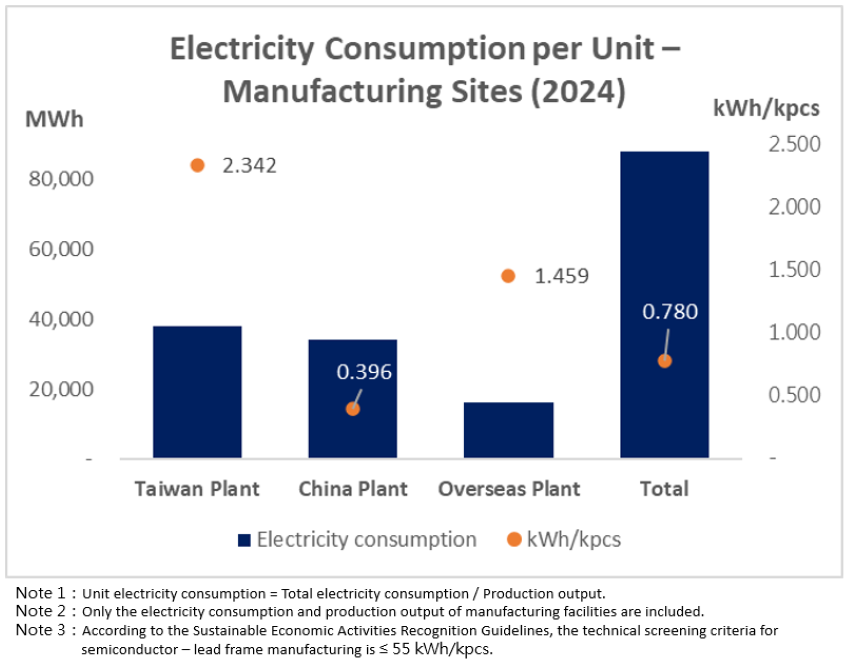
In 2024, the total electricity consumption reached 88,192,570 kWh(88,193MWH), with an electricity intensity of 5.12. The largest source of electricity consumption was process power and air conditioning equipment. The total electricity consumption and the intensity in 2024 increased compared to 2023, mainly due to the official mass production of the New Etching Plant at CWTC's Taiwan site and the capacity expansion at the Suzhou plant. Going forward, we will continue to focus on energy efficiency, renewable energy use, and alternative energy planning and execution.
| Year | 2020 | 2021 | 2022 | 2023 | 2024 |
|---|---|---|---|---|---|
|
Electricity consumption (Unit:MWH) |
68,591 | 74,460 | 77,666 | 76,649 | 88,193 |
|
Intensity (MWH/Revenue-in millions of NT$) |
4.20 | 3.60 | 3.55 | 4.65 | 5.12 |
Note: The 2023 data includes all consolidated entities, while data for 2020-2022 covers only the manufacturing plants of subsidiaries.
In response to global sustainability trends and the government-promoted “Green and Sustainable Finance Action Plan,” the company has conducted internal assessments and classification procedures in accordance with the “Sustainable Economic Activities Recognition Guidelines” issued by the Financial Supervisory Commission. These assessments evaluate whether our business activities and products/services align with areas such as the low-carbon economy, circular economy, efficient use of resources, and pollution prevention. In 2024, the manufacturing facilities of CWE Group met the criteria for sustainable economic activities in the semiconductor industry as defined in the guidelines. Moving forward, we will continue to strengthen our environmental sustainability initiatives in line with regulatory policies and international trends, while enhancing communication with stakeholders to achieve corporate sustainability and shared value for society.
※Energy-saving Measures
To effectively lower energy consumption and GHG emissions, we actively promote various energy-saving measures. The focus is on improving the energy efficiency of plant facilities and production equipment, optimizing operational efficiency by adjusting production equipment parameters, and replacing traditional lighting with energy-efficient alternatives. We aim to achieve our environmental and energy-saving goals through initiatives across its plants. Additionally, we raise energy-saving awareness by encouraging employees to turn off lights when not in use and shut down computers after work. We also promote the widespread use of energy-efficient lighting and install motion-sensor switches in areas with intermittent lighting needs to reduce energy waste by changing daily habits.

Energy-saving Measures and Performance of Each Plant in 2024
| Plant | Measures and Performance |
|---|---|
| Taiwan Plant | Replacement of chillers, additional purchase of new magnetic levitation chillers, load reduction of cleanroom circulation fans, and replacement of lighting fixtures in the underground parking lot achieved annual energy savings of 567,078 kWh (equivalent to 2,042 GJ). |
| Chengdu Plant | By shutting down air conditioning in standby areas, using chilled water from the raw water tank to replace chiller cooling for air compressors and electroplating air handling units, controlling air conditioning temperatures, adjusting the operating frequency of air compressors, and installing automatic stop functions on fans to reduce idle time, annual energy savings reached 570,730 kWh (equivalent to 2,055 GJ). |
| Malaysia Plant | Replacement of turbo air compressors achieved annual energy savings of 761,280 kWh (equivalent to 2,741 GJ). |
| Toral | 6,838 GJ |
Key Points of Energy-saving Programs
| Programs | Taiwan Plant | China Plant | Overseas Plant |
|---|---|---|---|
| Parameter setting | ★ | ★ | ★ |
| Production process integration | ★ | --- | ★ |
| Equipment process integration | ★ | ★ | --- |
| Energy-saving of facilities | ★ | ★ | ★ |
Progressive Energy-saving Plans
| Stage | Measures |
|---|---|
| Short-term |
|
|
Medium-and Long-term |
|
※GHG Emissions Management
To fulfill our social responsibility, CWE Group voluntarily conduct an annual self-assessment and disclosure of our GHG emissions. CWE Group has completed third-party verification of the entire group’s GHG inventory in 2024.
As purchased electricity is the main source of GHG emissions, we analyze the electricity consumption of our plant equipment and strive to reduce energy loss and improve energy efficiency.
GHG Emission Inventory
The subsidiary CWTC's Taiwan plant first implemented external verification of ISO 14064-1:2018 greenhouse gas inventory in 2022; the rest of the group initiated external verification of ISO 14064-1:2018 in 2023. For Taiwan, greenhouse gas emissions are calculated using the “Greenhouse Gas Emission Factors Management Table Version 6.0.4” announced by the Taiwan Environmental Protection Administration, the power emission factors published by the Energy Bureau of the Ministry of Economic Affairs, and the Environmental Protection Administration's “Product Carbon Footprint Calculation Platform.” For China, emissions calculations refer to the “2006 IPCC National Greenhouse Gas Inventory Guidelines,” the “China Product Life Cycle Greenhouse Gas Emission Factor Database,” the “2022 National Power Carbon Emission Factor” published by China's Ministry of Ecology and Environment, the Ecoinvent database, and the UK Department for Environment, Food and Rural Affairs (Defra) “Greenhouse Gas Reporting: Conversion Factors 2024” (hereafter “Defra 2024”). For Malaysia, emissions are calculated using “Defra 2024” and the grid emission factors published by the Malaysian Energy Commission. For Singapore, emissions are calculated using the grid emission factors published by the Singapore Energy Market Authority. The global warming potential (GWP) factors used are based on the IPCC Assessment Reports AR5 and AR6. No greenhouse gas emissions from perfluorinated compounds are reported across the entire group.
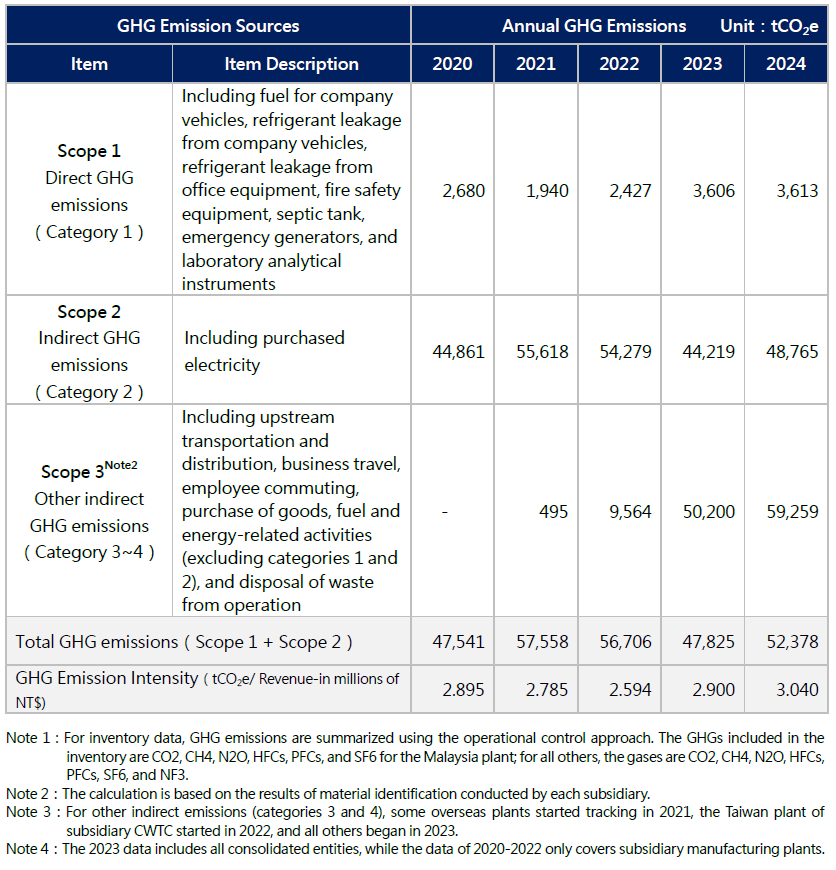
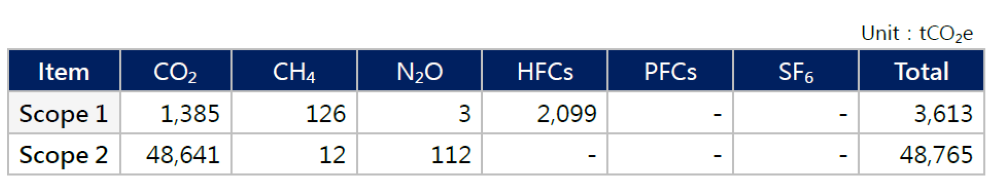
GHG Emissions for 2024
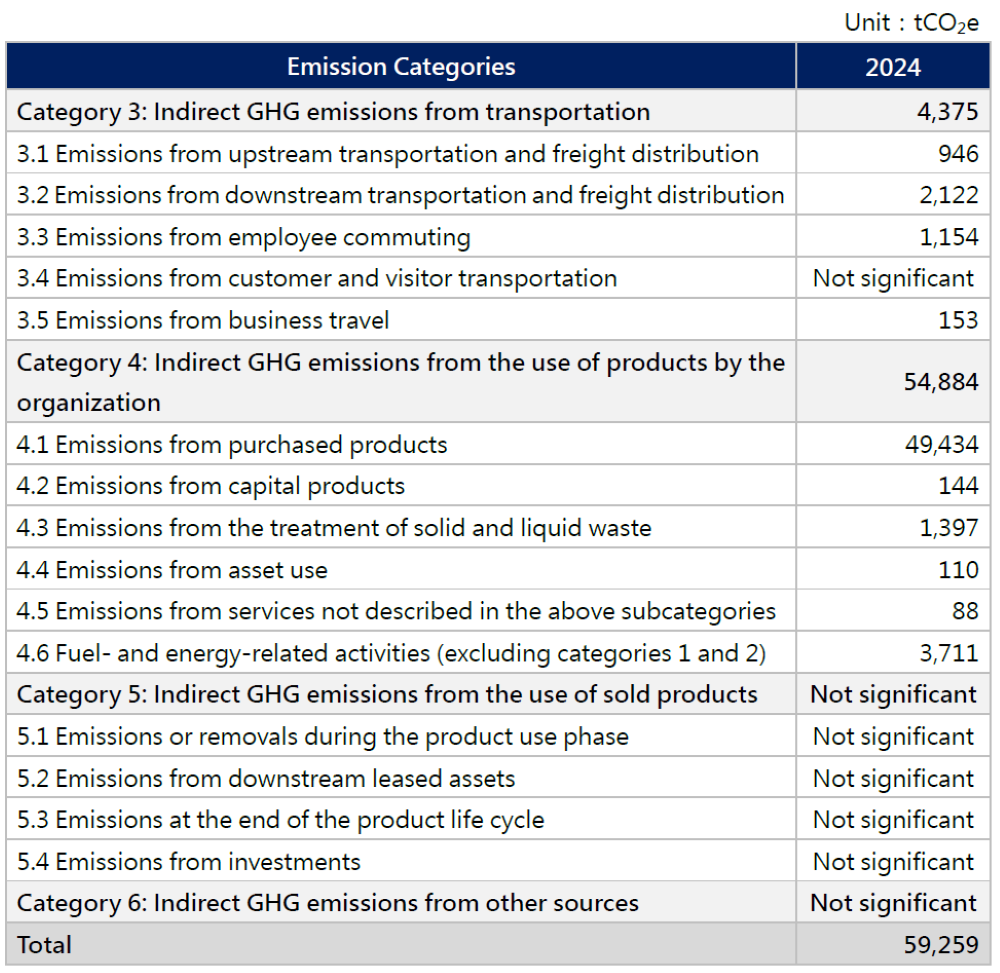
Scope 3 Emissions for 2024